Firebase Analytics 的新資料要多久才會出現在Firebase Console中?
How Long Does it Take for My Firebase Analytics Data to Show Up?
原文連結
※Firebase Analytics,以下簡稱FA
這可能FA的使用者是最常詢問的一個問題,我們認為這個問題值得花一些時間去深入探討,所以讓我們看下去吧
This is probably one of the most common questions we get around Firebase Analytics, and we thought it was worth taking some time to delve into this topic a little deeper. So buckle in, kids! We've got some learning ahead of us...
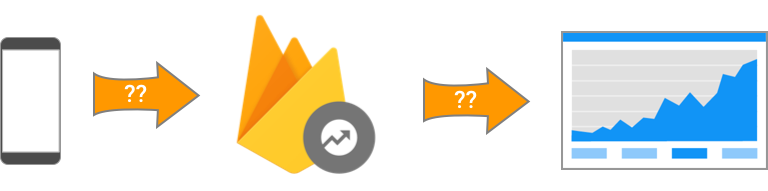
要了解FA整體的資料延遲狀況,我們需要了解下面這2點造成延遲的原因
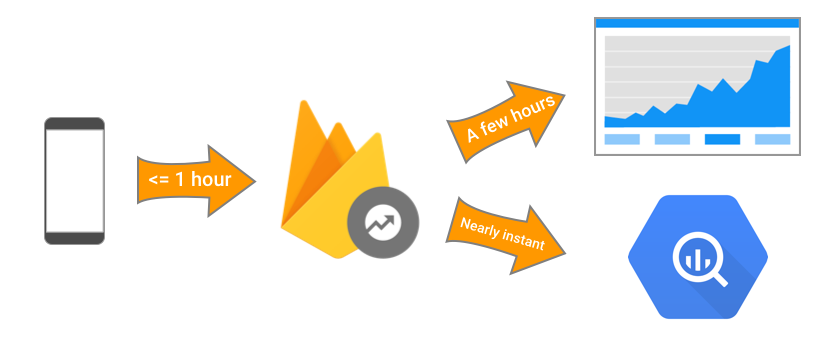
- 將Clinet端的資料上傳到FA Server所花的時間
- FA Server收到Client端的資料之後,顯示在Firebase console所花的時間
To understand latency with Firebase Analytics, there are two potential delays you need to be aware of:
- The time it takes for analytics data on the client to be sent over to the Firebase Analytics servers.
- The time it takes for Firebase Analytics data to be displayed to you in the Firebase console once it's been received on the server.
 讓我們循序漸進的看下去
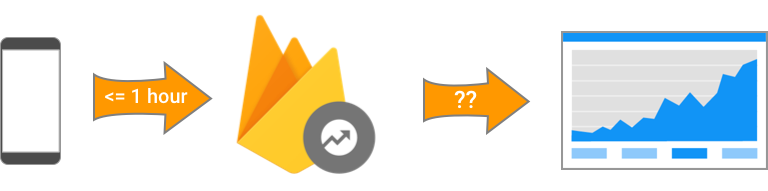
資料從Client端上傳到Server端所需的時間
Client-to-server latency
當有新的資料產生時,FA不會立即將資料上傳至Server,因為持續不斷地將資料上傳會導致Client端設備消耗較多的電量,考量到使用者設備的電池壽命,Firebase library會檢查Client端是否有已經儲存超過一小時的資料,如果有的話,會將資料批次上傳至FA Server
Firebase Analytics doesn't constantly stream down data from the client device. That would be a serious battery drain, and we want to be respectful of your users' battery life. Instead, analytics data is batched up and sent down when the client library sees that there's any local data that's an hour old.
在iOS設備上(和沒有Google Play Services的Android設備上),每小時檢查是否有新資料的計時器(以下簡稱Timer)在每個app中是各自獨立的,而在含有Google Play Services的Android設備上,是所有有使用FA的app共用同一個Timer
On iOS devices (and Android devices without Google Play Services), this one hour timer is per app. But on Android devices with Play Services, this one hour timer is across all apps using Firebase Analytics.
除此之外,FA會在使用者觸發轉換事件(像是應用內購買)時,將所有FA的資料上傳至FA Server。然而在iOS設備上,每當你的app被移至背景時,FA也會將資料全部上傳至FA Server
ps."conversion event",在Firebase內好像叫做轉換事件,這邊不太確定翻譯的正確與否
In addition, Firebase Analytics will send down all of its data from the client if your user triggers a conversion event (like making an in-app purchase). And on iOS devices, Firebase Analytics will also send down its data whenever your app goes into the background.
一小時才上傳一次資料?如果我的用戶使用不到一小時就流失了呢?
Hang on there -- once an hour? What about my users who churn out sooner than that?
不用擔心,在大多數的Android設備上,是由Google Play Services負責管理FA資料的傳送,這也代表即使你的使用者刪除了你的app,因為Google Play Service還存在,所以刪除app前FA所記錄的資料會在下一個Timer檢查時被上傳至FA Server
Not to worry. On most Android devices, it's Google Play Services that manages sending down this data. Which means that even if your user deletes your app after an hour, that data will still get sent down because Google Play Services still has it.
在iOS設備上,每當你的app被移至背景時,FA就會將資料全部上傳至FA Server。如果有一個使用者試用你的app,然後20分鐘之後解除安裝,由於解除安裝時必須將你的app移至背景才能切換到解除安裝的頁面,所以在解除安裝之前、app進入背景之後的這段時間,FA就會開始將資料上傳至FA Server,也就是說依然能拿到FA在這20分鐘內所記錄的資料。不過如果你的app在使用時當掉或崩潰,然後使用者立刻將它解除安裝的話,那麼FA在iOS設備上所收集到的資料將無法被傳送至FA Server,不過這個情況理論上比較不常發生啦
ps.按照他說的,這樣安裝完成app,試用完後先關掉網路再解除安裝,是不是資料就掰掰了
On iOS devices, Firebase will also send down data when your app moves into the background. So if a user tries your app for 20 minutes and then uninstalls it, that session data will still be received, because your app will have sent down the data the moment the user moved your app to the background. The one corner case where analytics data would actually get lost on iOS would be if your app crashed and then your user immediately uninstalled it.
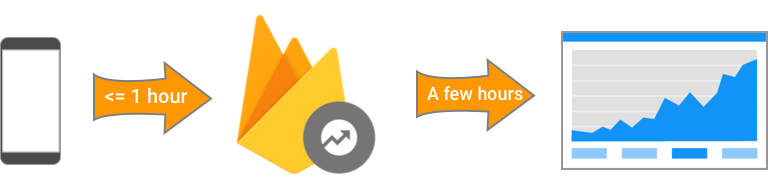
資料上傳至Server後到更新至Console所需的時間
Server-to-console latency
FA收到Client最新的資料之後,要過幾個小時才會將最新的資料更新至Firebase console中的報表和圖表中, 這就是Client端資料上傳至FA Server後預計會出現的延遲情況。
ps.文章中沒有講幾個小時欸,感覺是要看資料量
Now, moving on to the second case, there's also the frequency at which Firebase Analytics grabs the latest batch of data it's received from your client and uses that data to update the reports and graphs you see in the Firebase Console. This process typically runs every few hours. So that's the kind of delay you should expect after your client data is sent down to the server.
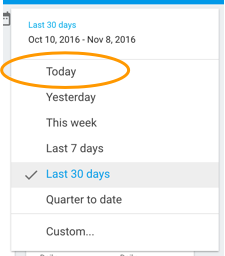
如果你要在報告中查看近期的資料,請記得「Last 30 days」報告中不會包含任何當天的資料,這是因為當天的資料尚未完整,如果不這麼做的話,會導致每個圖表中的數值不準確,讓使用者在閱讀報表後對數據產生誤解。而如果你想查看當天的資料,請在Firebase console的下拉選單中選擇「Today」
If you're looking for your most recent data in these reports, keep in mind that the default "Last 30 days" report doesn't include any data from the current day -- this is because the data for the current day is incomplete, and it would be misleading (not to mention a bummer) to see every graph end with a giant downturn in usage. So if you want to see the current day's data, you'll want to select "Today" from the drop down menu in the Firebase Console.
另一方面,如果你有設定將FA的資料匯出至 BigQuery,由於Firebase不需要進行資料處理,所以可以在BigQuery自動創建的app_events_intraday資料表中立即查看當天的所有數據,有關此功能的更多資訊,請閱讀我們之前發表的文章。
On the other hand, if you've set up your app to export all of its Firebase analytics data to BigQuery, this data _is _available for you to look at right away. There are no batch reports that need to be run, so you can immediately view all of the day's data by looking at the
app_events_intradaytable that's automatically created for you in BigQuery. For more about this feature, be sure to check out our earlier blog post.
 有辦法加速讓新資料快點出現嗎?
Anything that can be done to speed up this process?
正如在我們的Firebase開發者大會上所宣布的,我們正在加強Firebase Analytics中的DebugView和StreamView這2個功能,讓你在產品開發和上線時能更及時地了解你的數據。
As you may have heard at our Firebase Dev Summit, we've working on two enhancements to Firebase Analytics -- DebugView and StreamView -- which will give you more up-to-date insight into your analytics data during both development and production.
雖然上述的功能都還沒有正式上線,為了獎勵努力不懈閱讀的人,你們能得到註冊DebugView封測版的連結作為獎勵。
Neither of these are yet available to the general public, but as your reward for making it this far into the blog post, here's a link to sign up for the DebugView closed beta. See? Reading has its advantages!
如果我想要及時的Dashboard,我該怎麼做?
So, w?hat if I want a some kind of realtime dashboard? What should I do?
無論是應用內購買的數量突然下降,還是有許多人無法通過操作教學,許多開發者希望在他們的統計數據中出現不尋常的狀態時能收到通知
There are many developers out there who want to be notified as soon as they see something unusual in their stats -- whether that's a sudden drop in in-app purchases, people failing to make it through the tutorial, or what-have-you.
雖然Firebase console中的免費FA報告沒有提供上述的功能,但您可以透過將BigQuery與其他工具(如Google Data Studio)、第三方視覺化工具(像是Tableau)結合,或是撰寫屬於自己的Google Apps Script監控腳本來達成上述的功能,這些都可以讓你產生一些複雜的客製化報告,不過說實話,這些內容已經可以寫成另一篇文章了
And while you can't quite accomplish this with the free Firebase Analytics reports that you see in the console, you could accomplish this sort of thing by combining BigQuery with another tool such as Google Data Studio, a third-party visualization tool like Tableau, or even writing your own Google Apps Script monitoring script. All of which allow you to run some pretty sophisticated custom reports, but frankly, that's a whole other blog post.
但請記住,如果使用超出1TB /月的免費級別,那麼透過這些工具查詢數據時就要遵守BigQuery規範所產生的使用費用,所以請注意你處理資料時所使用的數據量以及使用的頻率
Do keep in mind, however, that you're still subject to BigQuery usage charges when you query your data though these tools if you go beyond the 1TB/month free tier, so be mindful of how much (and how frequently) you decide to process your data.
希望這篇文章可以讓你更了解需要多長時間才能看到FA的數據,以及在開發應用時可以期待什麼。 現在就開始記錄這些事件吧!
Hopefully, this gives you a better understanding of how long it takes for you to see analytics data and what you can expect when you're developing your app. Now go forth and start recording those events!